2015
Website Traffic & Social Media | Global
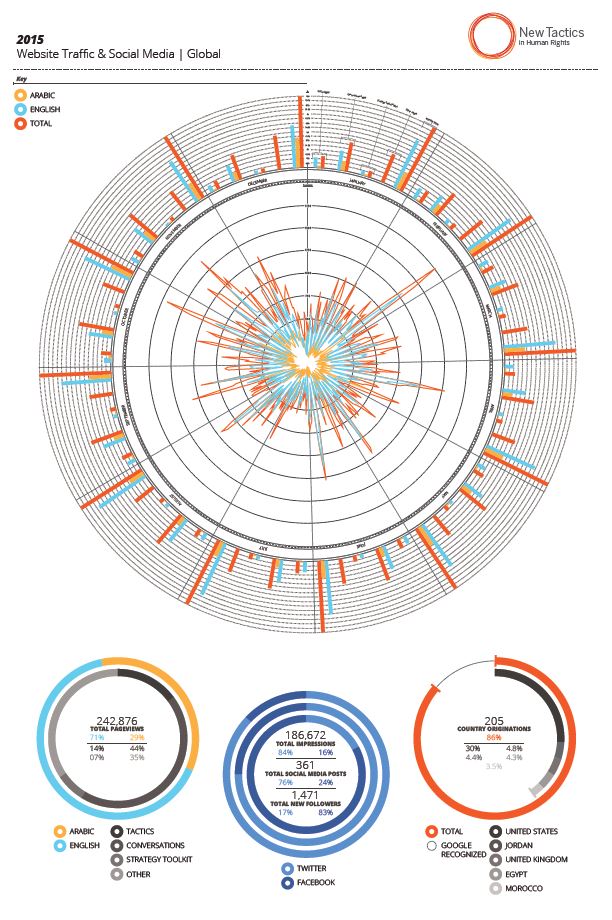 The data found in the Website Traffic & Social Media Infographic represents New Tactics in Human Rights online interactions for the year 2015. The most prominent graphic shown within the infographic illustrates the number of pageviews to newtactics.org. Represented as a radar graph, each point of data represents one day of the year 2015. Encircling the radar graph is a column graph representing, by month, total pageviews broken down by category of content and language (Arabic or English). Below the radar/column graph are three circular bar graphs. This data provides totals for the website including: pageviews by content and language; countries ranked by highest traffic; as well as New Tactics social media data for Twitter and Facebook (English only).
| Attachment | Size |
|---|---|
| 147.09 KB |